There are 2 major ways to analyze the markets to make our decisions to enter a trade. They are:
1. Fundamental analysis
2. Technical analysis
There is nothing saying that you have to analyze the markets in only one of these ways, you can combine the 2 and get a better overall feel for what the markets will do. Let’s talk a little about each kind of market analysis.
Fundamental Analysis
This way of evaluating market movement is based on what is going on in the world. Taking a look at the economic, political and social forces will give you a good idea how the market will move. As a country’s employment numbers drop, the value of their currency will also drop. If a country has a record month in regards to exports, that county’s currency will rise in value. Weighing all the different economic factors give you an impression of the strength or weakness of a currency.
In a nutshell, fundamental analysis is a way of analyzing a currency through the strength or weakness of that country’s economy.
There are regular new releases that are marked on Forex financial calendars, in fact there are websites devoted just to these fundamental economic new releases.
It’s good to be aware of these upcoming news releases before you trade. They are scheduled and shouldn’t be a surprise when they happen. Some of these news releases can make the markets react very quickly as opposed to the longer term economic data that move the markets slowly and over a longer period of time.
One of my favorite places to go for these regularly scheduled fundamental news releases is Forex Factory.
http://www.forexfactory.com/calendar.php
The tell you when the release will happen, what country it comes from (US news will affect the US dollar) and what significance the report will have on the markets behaviour (ranging from a strong influence to no influence).

Technical Analysis
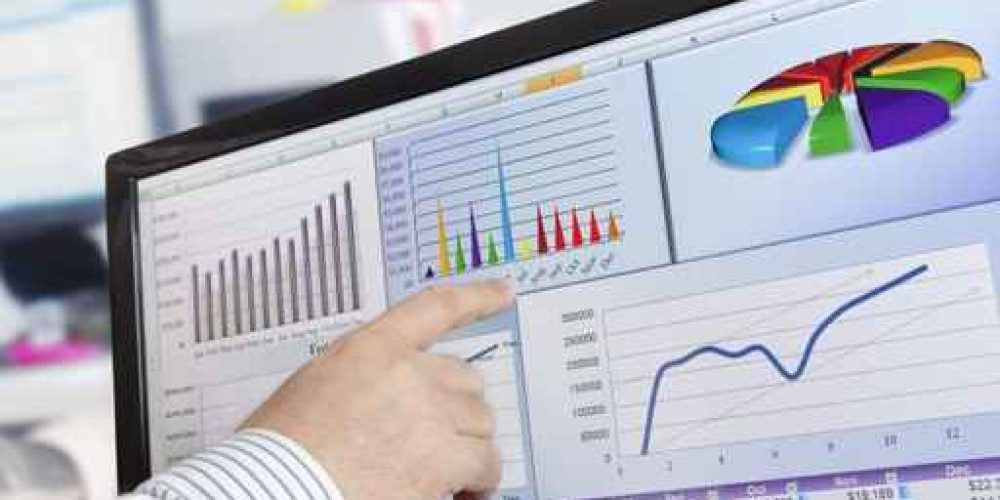
Technical analysis is the study if the markets past price. This is usually done on a chart. Looking at historical price data can give you an idea of where price is likely to move in the future. Viewing a chart shows you where price has been and using chart analysis, you can determine where price is going.
You can see where the market had a tough time moving, or where the market turned around. You can see if the market is currently trending or if it is undecided and just bouncing up and down. Using this information, trades have developed methods to interpret future price movements and profit from it.
 In the above example, you can see where price was having a hard time getting any higher. If we connected the tops, we would have a “trendline”. This is a common tool in technical analysis. As the price broke through the line, there is a good chance the price would continue to go farther. Some good technical analysis there!
Technical analysis is preferred by almost all traders. It’s instant and it works on all timeframes. If you want to be in and out of the market within a day for short term gains, technical analysis is the only good way to do that.
The tools at the disposal of a technical trader are called “indicators” and they are out there by the thousands. More isn’t always good, especially when it comes to technical analysis, but that is a topic for another blog post.
Best regards
Russ